
US housing unaffordability is at its highest peak since the early 1980s. Yes, even surpassing (albeit slightly) the height of the pre-Great Recession bubble. The graph below charts unaffordability over time, where the higher the blue line, the more unaffordable housing is for 50% of household incomes.

What happens next?
The early 1980s provides the best precedent to see how things might play out. Like today, housing unaffordability was high and inflation was a significant issue (though it was a larger issue back then, with inflation peaking roughly two-times higher). In the early 1980s, the Fed similarly raised the federal funds rate to slow down spending and quell inflation.
Housing unaffordability is caused by income being too low, cost of living being too high, or housing being too expensive. I’ll compare these variables from the early 1980s to the current day. Keep in mind that this research looks at the United States as a whole, and specific areas can differ significantly (like Phoenix).
Is income too low?
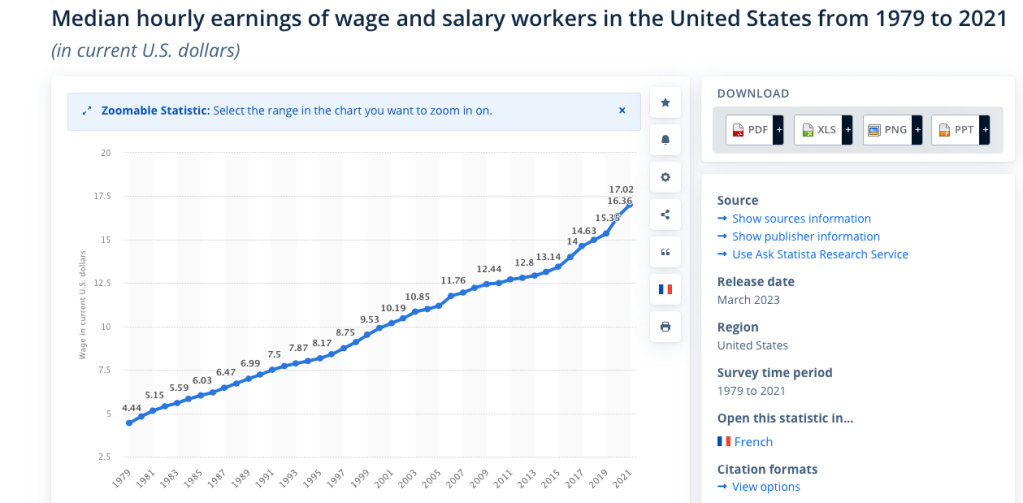
Whether looking at real (inflation-adjusted) or nominal (non-inflation-adjusted) incomes, income is on-par or slightly higher than the long-term baseline. Unfortunately, I can’t find data before 1979, but it doesn’t seem that income was an issue in the 1980s housing affordability crisis, and it’s not an issue in today’s. It’s unlikely that income will rise to close today’s affordability gap.
Is the cost of living too high?
Exploring the cost of living was extremely interesting. Of course we hear about inflation being high today. As seen below, inflation hasn’t been so high since the early 1980s:

However, the Consumer Price Index (a sample measure of goods and services which measures the cost of living), excluding shelter, below, is currently on-par with long-term trends (albeit currently 1.8% over, which is insignificant compared to historical data), despite the velocity of its inflationary run since 2020. The inflationary environment we see ourselves in right now is more of a return to the baseline after goods were roughly 4% under long-term trends.
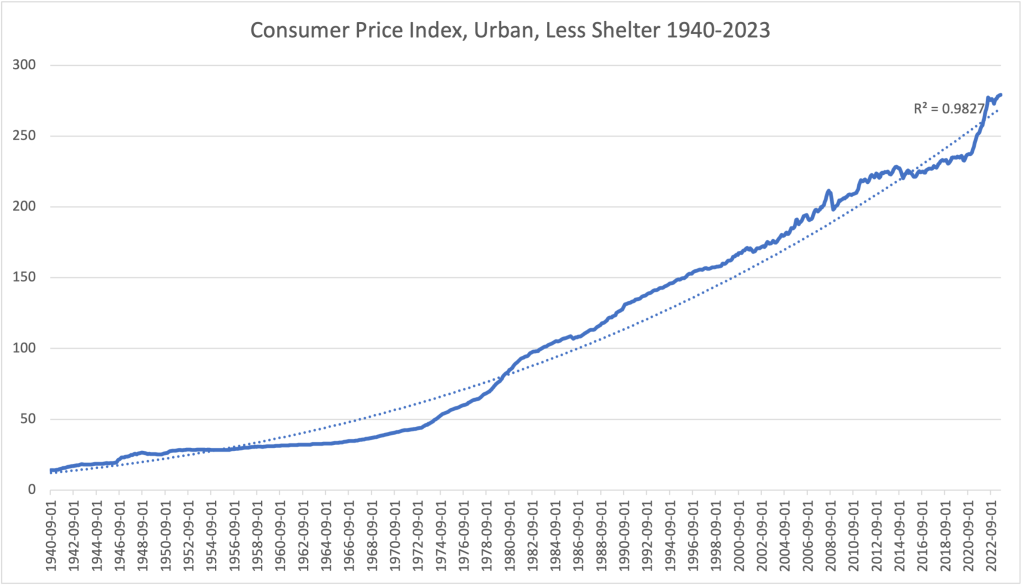
In the 1980s, the CPI didn’t have to decrease for housing unaffordability to resolve. Also, the CPI (excluding shelter) today indicates that non-housing costs are roughly on track with long-term trends. For both of these reasons, it doesn’t appear that non-housing costs are at fault for housing unaffordability.
Are housing prices too high?
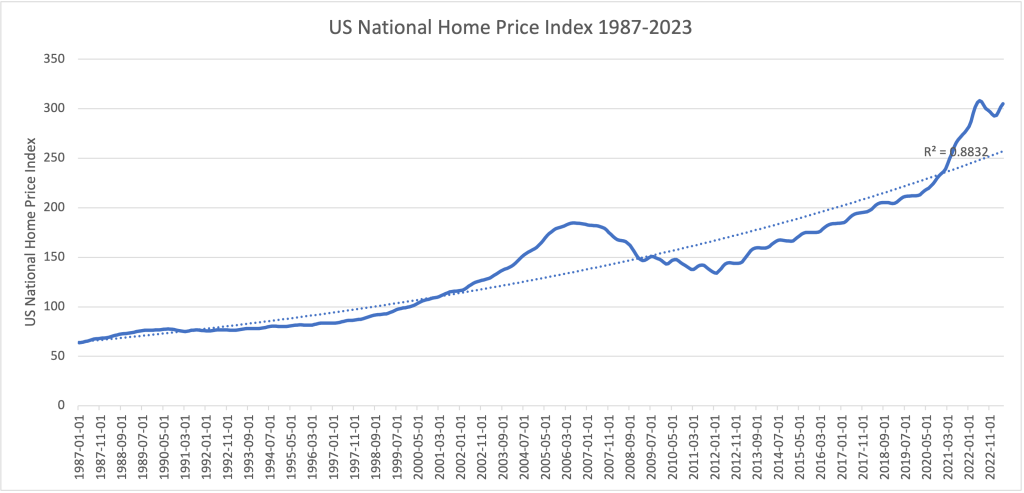
The red line in the first graph above represents the median US home price, which appears scary steep since 2013. Most of that run is recovery from the housing bubble burst that caused the Great Recession. However, as shown in the graph below, housing prices have veered into overvalued territory.
I tried finding more data to see housing prices during the early 1980s, and although I couldn’t find the same housing index data, I did find data for the median sales price of homes sold:

It’s interesting how the current story looks different when comparing the housing price index to the median price of homes sold. The latter implies that the housing market is at the baseline, if not slightly under. This inconsistency may be indicative that housing prices are currently listed too high, and most people aren’t buying unless the price is low enough.
One thing is clear though: in the 1980s, housing unaffordability dove without impacting prices of sold homes. Will this outcome repeat in today’s affordability crisis? Possibly. It’s also possible that the housing price index in the early 1980s was also elevated like today’s (I would really like to find that data).
How did housing prices get so high?
As is the case with all markets, housing prices are an outcome of supply and demand. A lot of pundits talk about the lack of new builds in the 2010s causing the affordability crisis; that new build construction (supply) hasn’t kept up with population trends (demand). Although it is true that new housing unit construction slightly slowed in the 2010s, it isn’t by a significant degree. In fact, the difference between housing units per person from 2010 to 2020 is actually up 1.2%.

The table above shows the US has more housing units per person today than at any time as far back as 1975 (limited by data). The data doesn’t support the thesis that housing supply hasn’t kept up with population growth.
It’s apparent that the main cause of the affordability crisis is solely the macroeconomic environment. People and corporations excessively invested in real estate in the last few years, buying up secondary and investment homes, because of an extremely long period of “free money” through near-zero interest rates and excessive stimulus during the covid-19 pandemic. As the Fed continues to raise borrowing rates, this trend is sure to reverse.
Conclusion
Similar to the 1980s, the Fed is raising borrowing rates to dampen overvaluation in the housing market, which is the fault for today’s housing affordability crisis. Today’s elevated housing price index implies that housing prices (as of May 2023) need to come down roughly 17% to sell. The average person is generally unwilling to pay a premium for housing anymore. For those renting or looking to buy a home, relief may be slow, but it’s on its way.
9/1/2023: I replaced the CPI data with CPI data that excludes shelter to isolate non-shelter costs. I also reorganized the article to improve flow.

Leave a comment